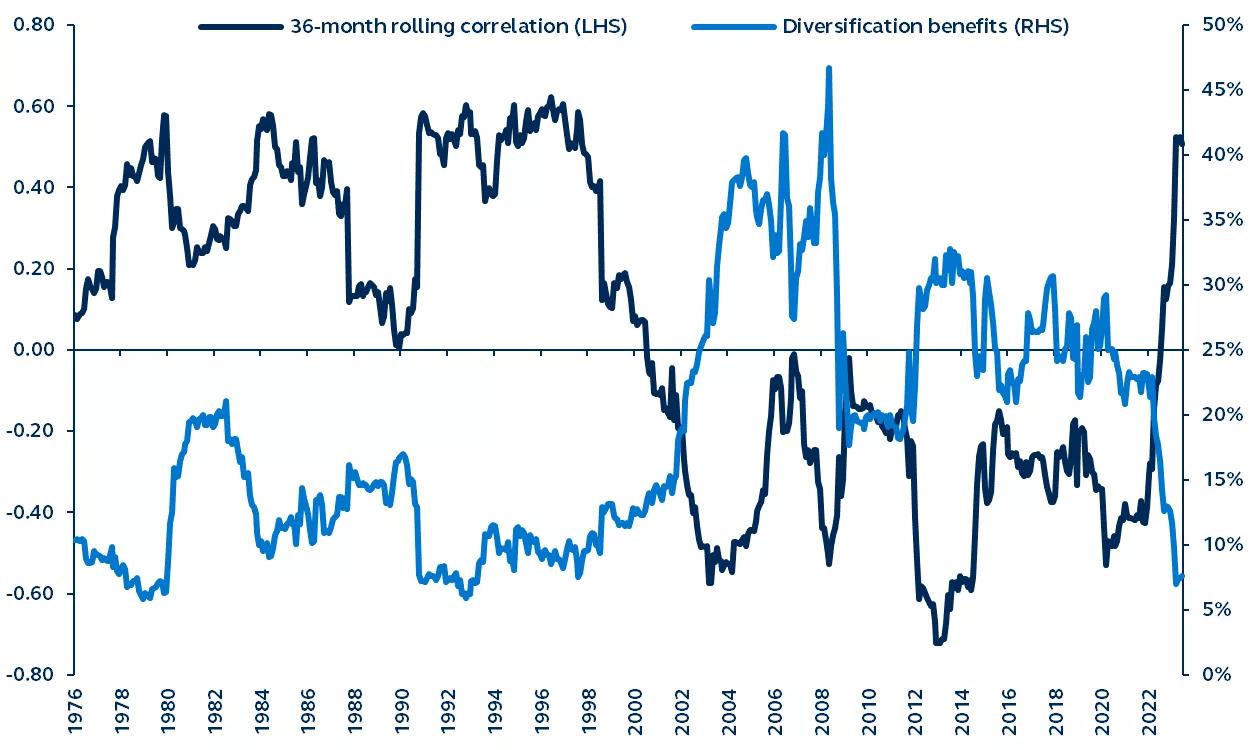
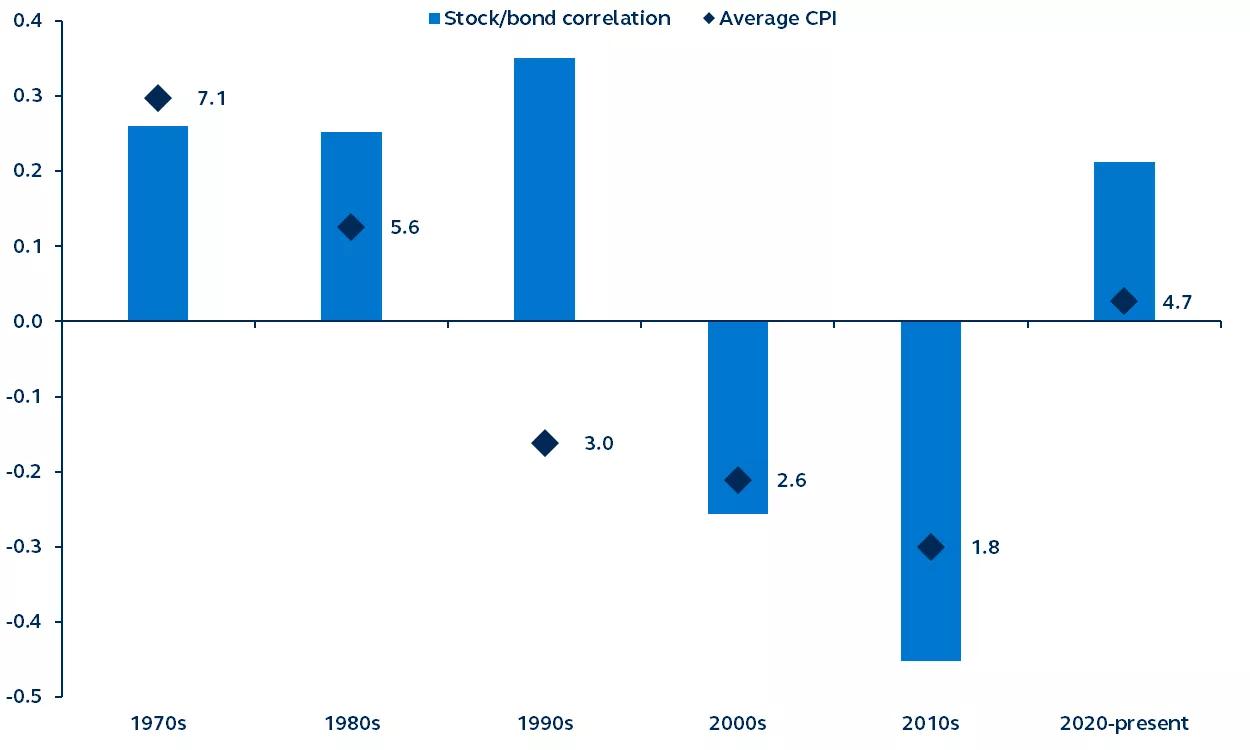
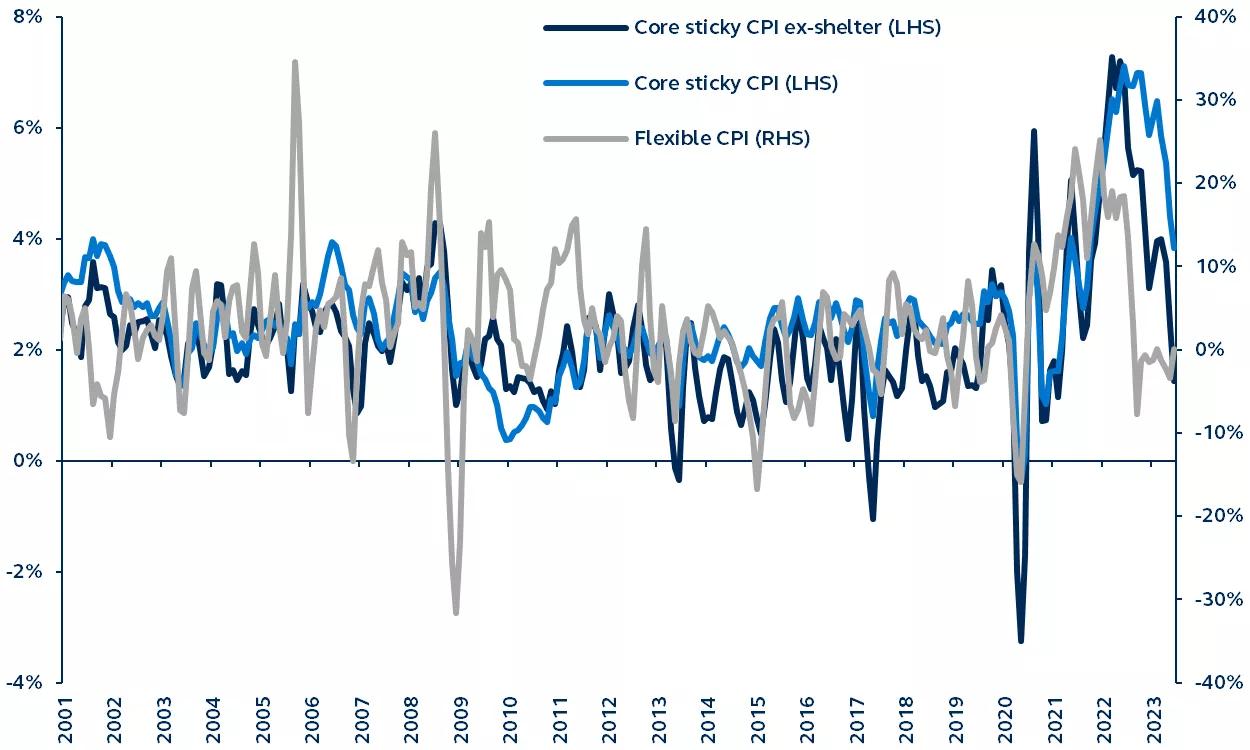
The “60/40 portfolio” (60% stocks, 40% bonds) suffered a historically bad run in 2022, prompting many market practitioners to question...is the 60/40 portfolio construct dead? With the stock/bond correlation rising sharply in just a few months, the diversification benefits and alpha potential of the 60/40 dwindled, hurting both the strategic construct and tactical asset allocation of multi-asset portfolios. Fixed income yields were hovering near historic lows, providing limited cushion for 60/40 portfolios against losses in equities, especially as it was accompanied by rising interest rates. Yet, an examination of inflation and growth dynamics suggests that the elevated stock/bond correlation is likely temporary and should normalize lower as inflation stabilizes. Lowered stock/bond correlation and higher fixed income yields suggest that the fundamental construct of the 60/40 portfolio remains attractive.
Diminishing diversification benefits
60/40 portfolios have delivered 9.4% annual returns over the last five decades, only marginally below the S&P 500’s 10.9% return, but with much lower volatilities. For investors with a more limited risk budget, or for those who sought out a potentially more consistent investment experience, the 60/40 portfolio has been quite an attractive option. Why has the 60/40 portfolio historically offered better risk-adjusted returns than the S&P 500? The diversification benefit—which is mainly driven by low stock/bond correlations.1 When stock/bond correlations are low, the diversification benefit is high, and vice-versa.
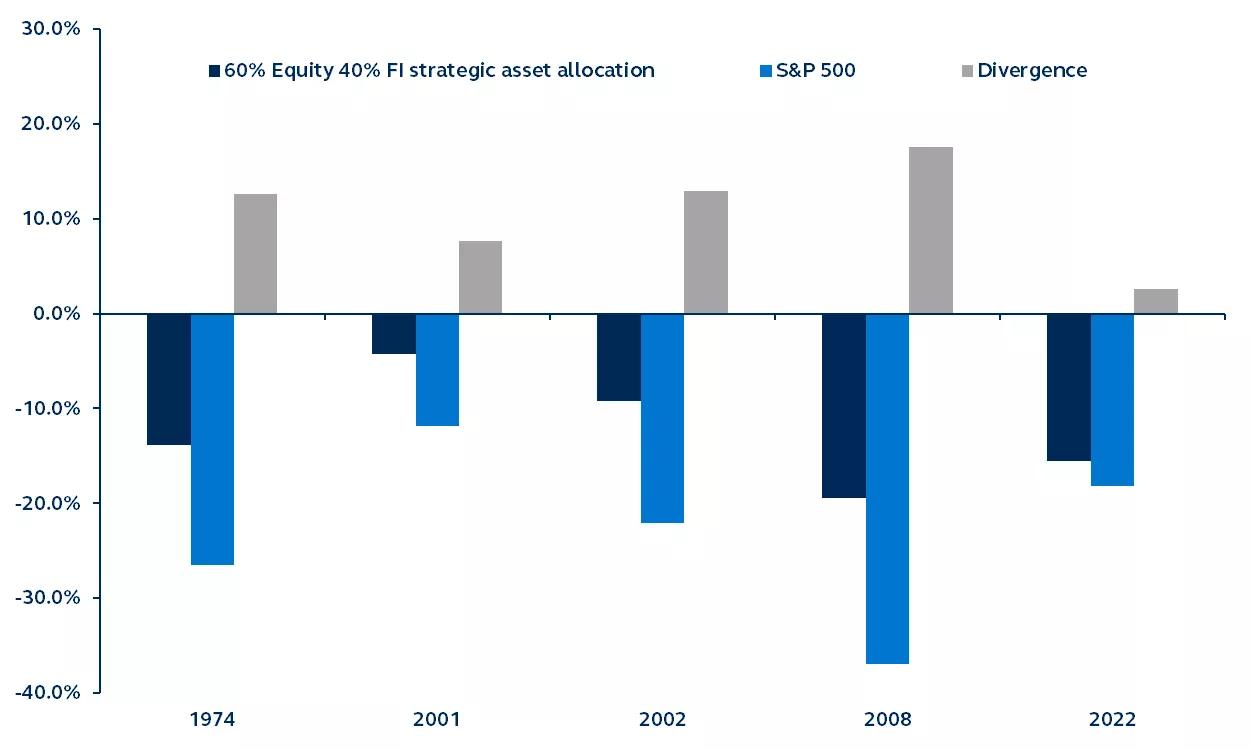
Since 1973, there have been five instances when the S&P 500 delivered an annual loss of more than 10%—the 60/40 portfolio outperformed the S&P 500 in each instance. In 2022, however, with heightened stock/bond correlations, the returns of equities and fixed income fell in tandem amid market meltdowns. Combined with already low starting bond yields, this created an environment where, despite still outperforming the S&P 500, the 60/40 portfolio recorded its second-largest annual loss since 1973.


