A more challenging environment

The investment landscape has been significantly impacted by the shift in the Federal Reserve’s (Fed) monetary policy beginning in March of 2022. In response to a rapid acceleration in inflation, which reached a 40-year high in the U.S., the Fed has engaged in the most aggressive rate hike cycle since the early 1980s. The central bank is also reducing the size of its balance sheet, which ballooned to over $9 trillion at the start of 2022, further reducing liquidity to capital markets.

The fallout from the shift away from a ‘zero interest rate policy’ is having a dramatic impact across all asset classes and particularly commercial real estate (CRE), which has benefited over the past decade from the low-interest rate environment. With interest rates climbing rapidly, the post-COVID boom for commercial real estate has transitioned to correction.

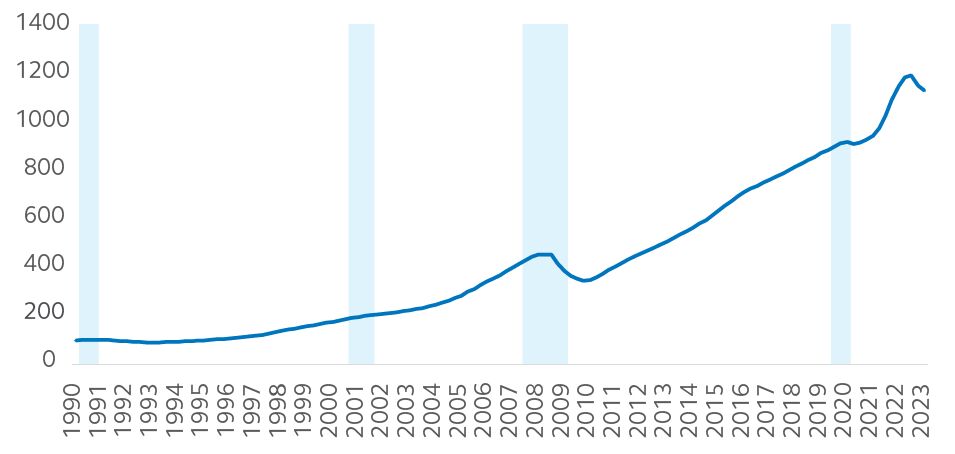
Despite an economy and labor market that has proved more resilient than most forecasters would have predicted at this point, the capital market environment for real estate has become much more challenging. And, while a mild to moderate recession is being priced in by capital markets, historically commercial real estate has a healthy track record of providing long-term returns for investors (see Exhibit 1).

EXHIBIT 1: Long-term private commercial real estate investors benefit from stable total returns1
NCREIF National Property Index Total Return
Index (1990=100)

Source: NCREIF NPI, Principal Real Estate, Q1 2023. See appendix for index description. Indices are unmanaged and do not take into account fees, expenses, and transaction costs and it is not possible to invest in an index.

Continued scale and diversity

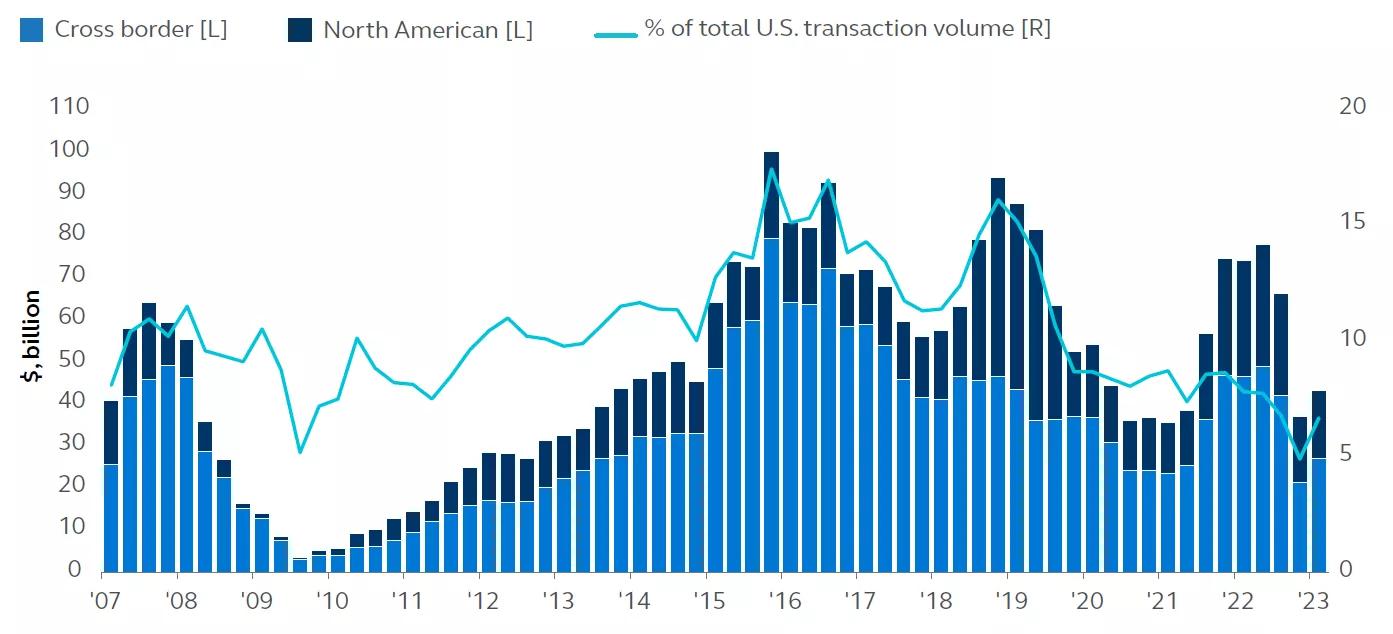
Despite a material slowdown in investment activity in the transaction market since the start of 2023, including a pull-back in cross border inflows, the U.S. remains a top destination for institutional capital on a global basis. In 2022, global investors purchased nearly $35 billion in U.S. real estate assets with Dallas, Seattle, Manhattan, Atlanta, and Chicago being the most active markets. Moreover, the U.S. commercial real estate market is incredibly liquid with an estimated market capitalization of roughly $18 trillion (as of the end of 2022).2 To put this in context, the value of the U.S. stock and bond markets are $38.1 trillion and $28.8 trillion respectively.3 Within the developed world, we estimate that the total commercial real estate universe in Europe is a close second with roughly $17.0 trillion in market capitalization, followed by China and Japan adding $10.1 trillion and $2.8 trillion respectively.

In addition to its substantial investible universe, the U.S. market is also relatively liquid, as measured by the velocity and volume of transactions (Exhibit 2)—supported by a well-developed and efficient debt market. U.S. transaction volumes have been trending at historically high levels in recent years with a noteworthy share of sales (just around 7%) generated by international investors.4 Since the Global Financial Crisis (GFC), these foreign transactions have ranged from 7% just following the recession to a peak of 17% in 2015, which represented peak acquisition activity in the U.S. by mainland China investors. Even as Chinese investors have taken a step back from U.S. real estate, the more recent flow of international capital is meaningful in its contribution to the depth of the market and is perhaps more in line with historical norms.

EXHIBIT 2: U.S. CRE sales trend upward on a long-term basis
Cross border and North American direct acquisitions of U.S. commercial property

Bar chart

Source: MSCI Real Capital Analytics, Cross-Border Compendium, 31 March 2023.

Furthermore, investors in the U.S. can access a wide array of risk/return strategies across the real estate debt and equity spectrum. Most of the investment universe is within the private market (84.8%) with equity investment (direct property ownership) contributing the largest portion (63.1%) followed by debt investment (direct loans/mortgages) accounting for the remaining balance (21.7%). The balance is split between public debt, commercial mortgage-backed securities (CMBS), and real estate investment trusts (REITs), which account for 8.7% and 6.5% respectively.5 (See Exhibit 3).

EXHIBIT 3: The U.S. CRE market is deep and diverse
Commercial real estate universe in the U.S.
(in $ trillions)

Pie chart

As of 31 December 2022.

Source: Federal Reserve, NAREIT, Preqin, CoStar Portfolio Strategy, Barclays, J.P. Morgan.

The breadth of investments is another constructive feature of the U.S. private real estate market. The sheer size and variety of the U.S. economy provide both regional and economic diversity ranging from the tech-focused markets in the Northeast and Northern California, to metropolitan areas with outsized demographic growth in the Southeast and Southwest regions, which take advantage of both business and household migration due to lower costs and warmer weather. Even older and more established markets can offer investors unique opportunities. Markets like New York, with its focus on finance; Chicago known for infrastructure and corporate headquarters; and Washington DC, which serves as a seat of global political power, all offer diverse industrial and commercial real estate drivers across both traditional and alternative sectors.

EXHIBIT 4: Principal’s high-conviction private equity CRE markets
Growth drivers

Pie chart

Source: Principal Real Estate, 30 June 2023.

Growth in alternative sectors

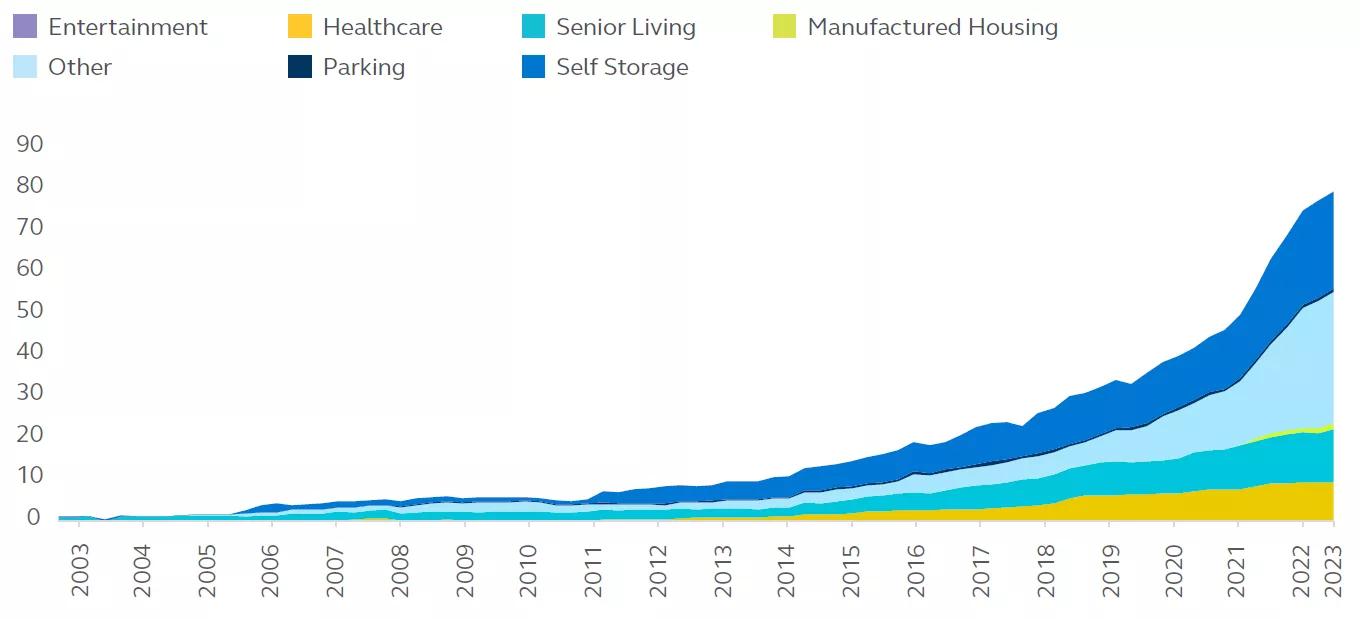
Private commercial real estate in the U.S. has long been dominated by those sectors deemed as qualifying for NCREIF’s National Property Index, which were defined when the index was created in 1982. These property types—Apartment, Hotel, Industrial, Office, and Retail—still comprise the lion’s share of the private institutional investment universe (92.6%) according to data from the NCREIF research database but are increasingly losing ground to alternative sectors. Today, these emerging sectors account for nearly $80 billion, or 7.6% of all properties in the NCREIF research database.6 To put this figure into a broader perspective, since 2020 the value of alternative assets tracked by NCREIF has grown by 122% (Exhibit 5).

EXHIBIT 5: Alternatives to major property types are on the rise
Niche property type market value in NPI, $billions

Graph

Source: NCREIF Query Tool; Principal Real Estate, Q1 2023.

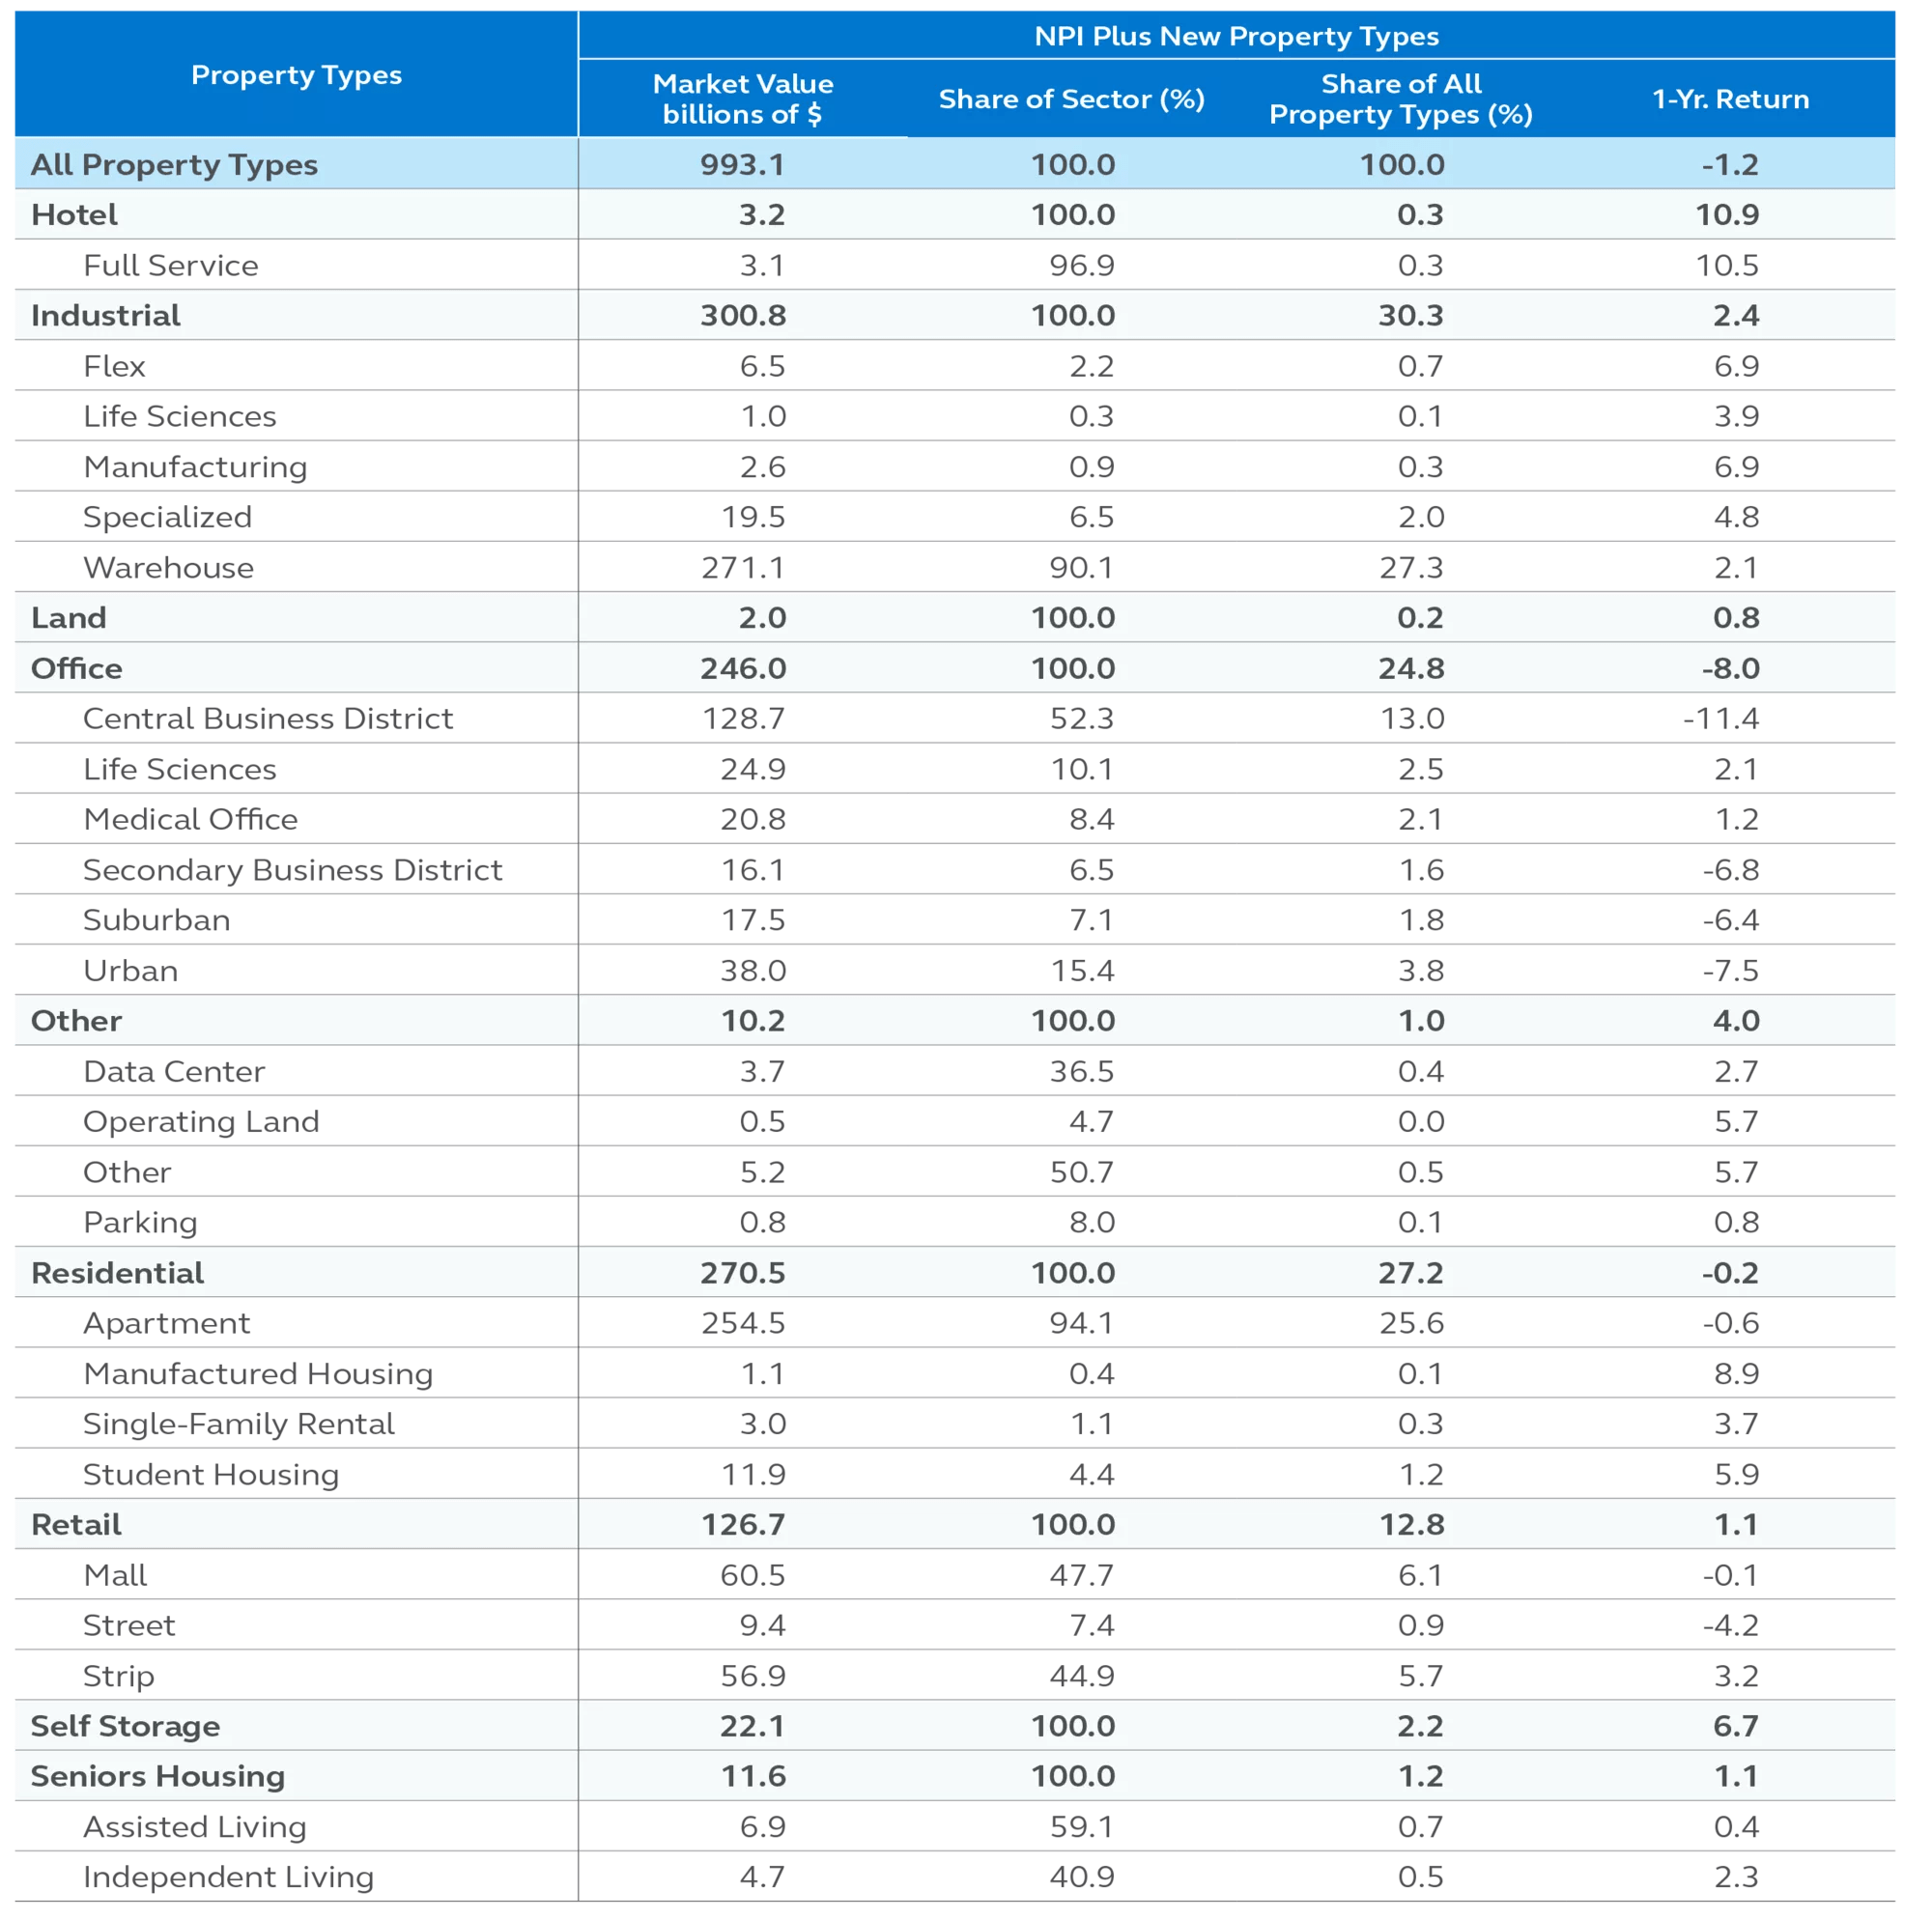
While listed REITs have long been active participants in alternative sectors such as data centers, cold storage facilities, senior housing, medical office, and self-storage, private equity real estate investors are catching up. In recognition of this trend, starting in Q3 2022, NCREIF began releasing returns for its new property type definitions, which include increased granularity of existing qualifying and non-qualifying properties such as data centers, life sciences, medical office, and single-family rentals. The reclassifications also allow institutional investors to benchmark alternative investments and gauge the depth and breadth of the market for emerging sectors more easily.

Exhibit 6 displays the new property type definitions and their shares of the overall market value for properties in the NPI research database. Though the private sector has a long way to go before it reaches parity with its public market counterpart, we believe that the growth in alternative sectors will continue to offer increased depth and diversity to private investors over the next decade.

EXHIBIT 6: Market value, shares, and 1-year returns for new property type definitions

Table

Source: NCREIF, Principal Real Estate, Q1 2023.

Investment performance provides a compelling argument

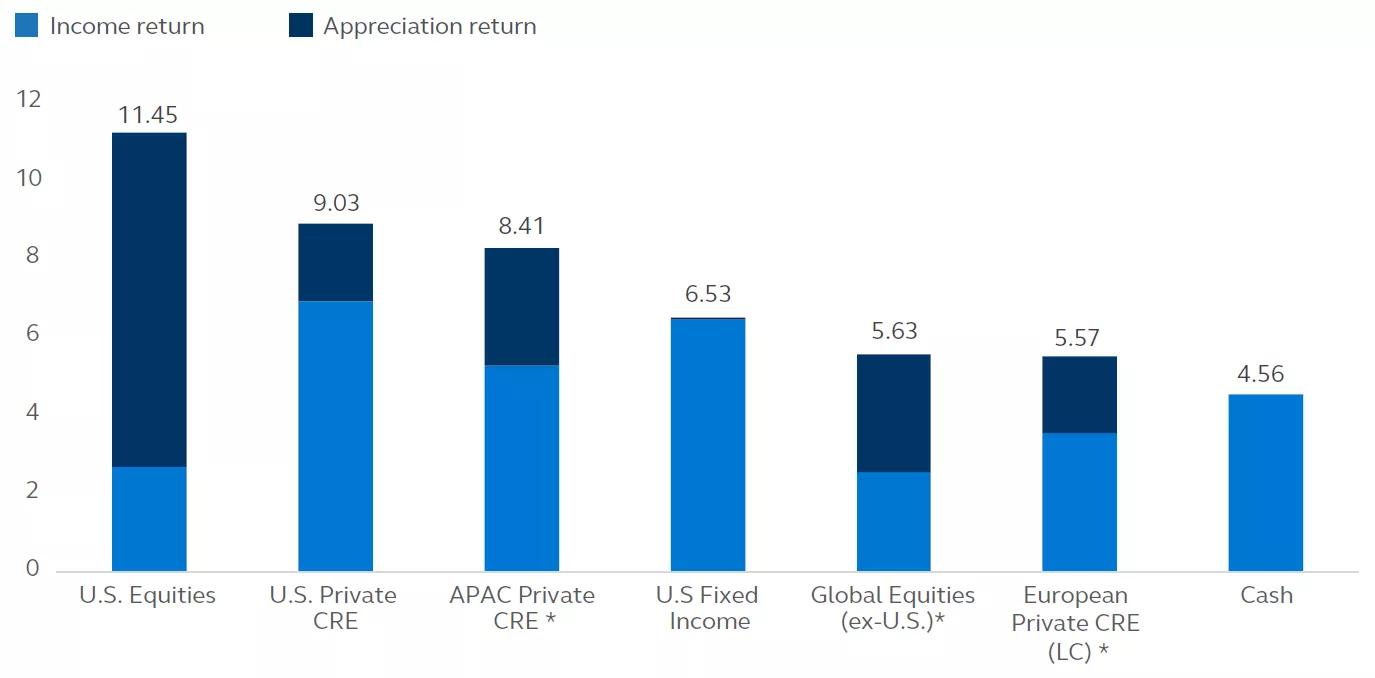
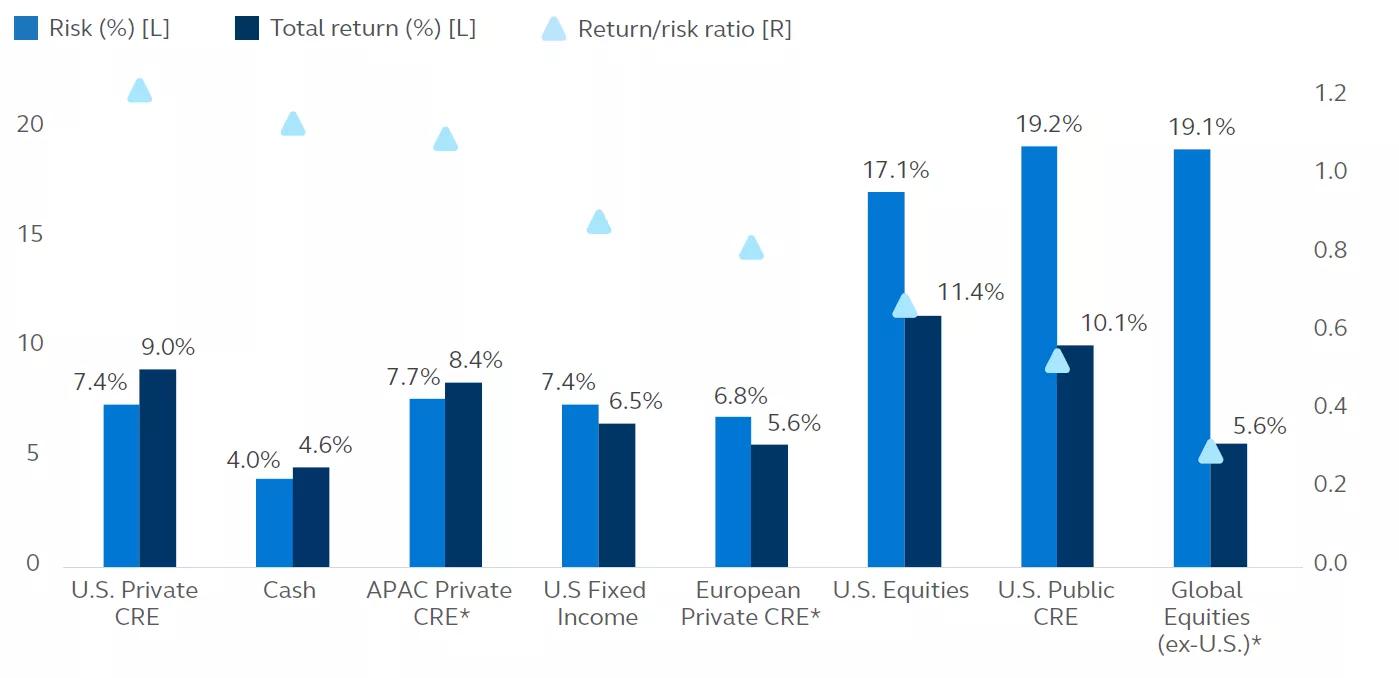
On both a risk-adjusted and absolute basis, U.S. private real estate has an attractive historical track record. Since its inception in 1978, the NCREIF NPI has shown that U.S. commercial real estate has historically been one of the better-performing asset classes. While U.S. stocks have delivered top performance (11.4%), private CRE hasn’t been far behind delivering a compounded average annual total return of 9.0% since data started being tracked in 1978 (Exhibit 7). One of private real estate’s greatest attributes, however, is its ability to provide relatively stable income returns to investors, which acts as a governor on volatility through business cycles. A majority of commercial real estate returns are generated through income derived from rental payments on leases. As a result, private real estate has outperformed many other asset classes with respect to income return. This relatively stable return characteristic is highly valuable to income-seeking investors.

EXHIBIT 7: Commercial real estate performance holds its own as an asset class.
Compounded average annual total return (%), Q4 1977 - Q4 2022

bar chart

Source: NCREIF, Barclays, Bloomberg, INREV, ANREV, Principal Real Estate, 31 December 2022; See appendix for definitions.
(*) Indices full history only dating back to Q4 2004, Q1 2000, and Q4 1987 for APAC and European Private CRE, and Global Equities (ex. U.S.), respectively. Indices are unmanaged and do not take into account fees, expenses, and transaction costs and it is not possible to invest in an index.

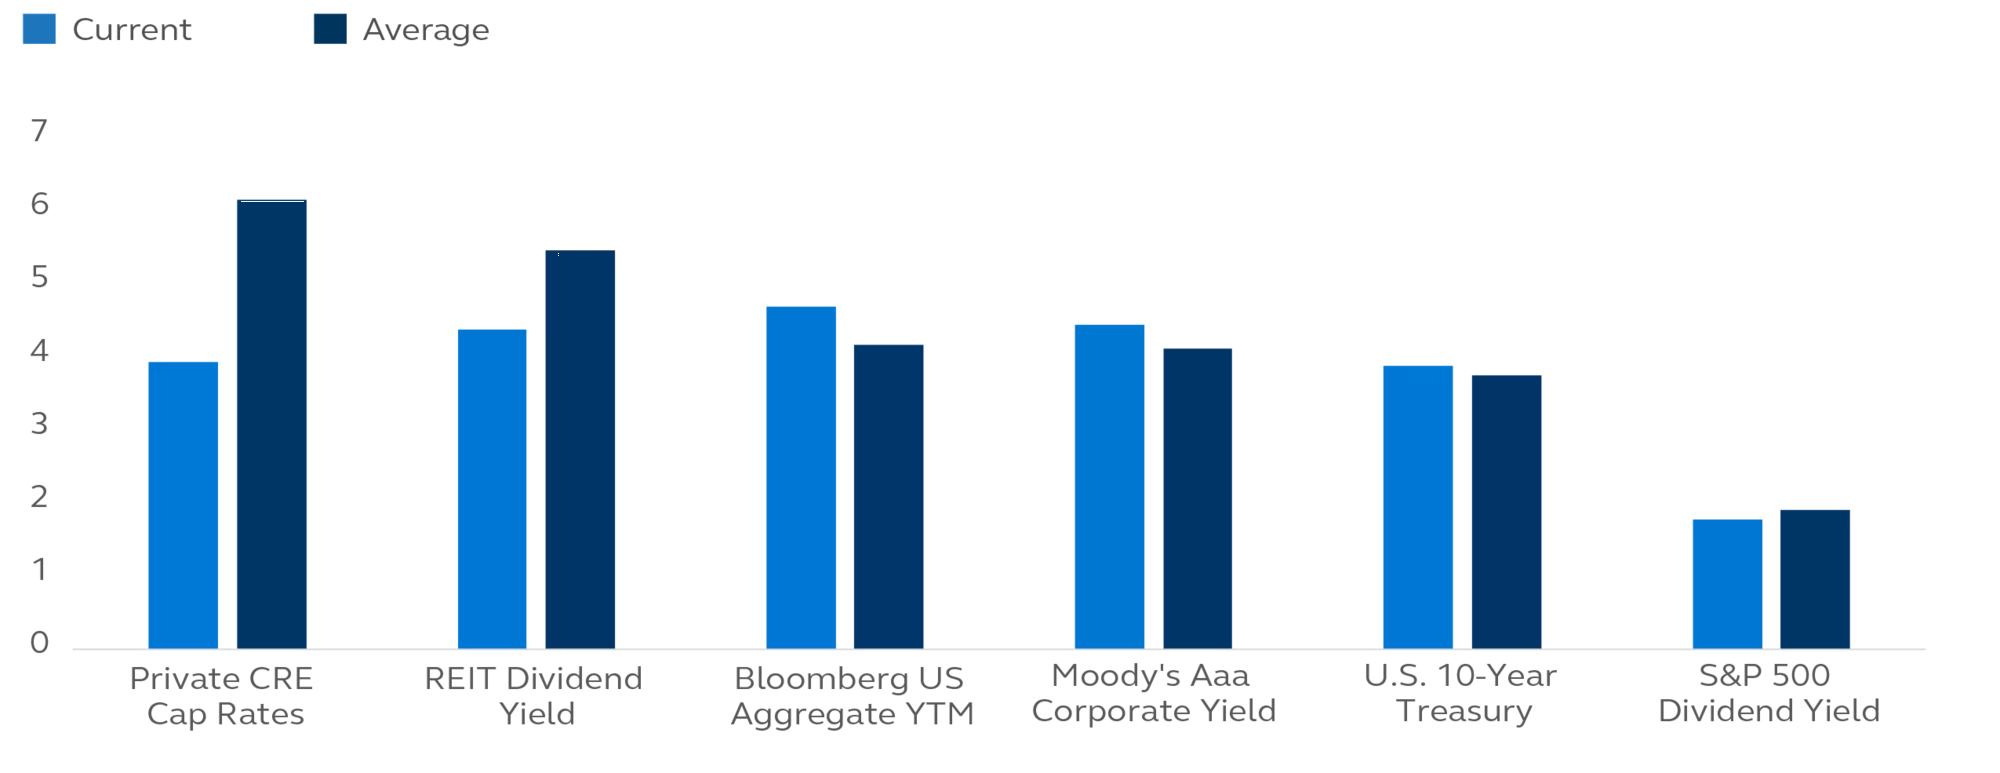
The income component of real estate is perhaps as important in today’s environment as ever. The yield curve has been inverted during much of the past year, which happens when investors are uncertain of current conditions and purchase long- dated securities, pushing up short-term rates. It can also occur when the Fed increases short-term rates to slow economic growth. Irrespective of the reason, we remain in a higher interest rate environment relative to the past few years, and higher rates on long-dated treasuries (e.g., the 10-year treasury) have led to compressed spreads on fixed-income assets. By comparison, yields on commercial real estate (best represented by its capitalization rate) have not only remained attractive compared with other asset classes but have historically held up better over the long run (see Exhibit 8).

EXHIBIT 8: Real estate yields holding up well on a relative basis
Q3 1994 - Q4 2022 yields (%)

bar chart

Source: NCREIF, NAREIT, Barclays Live, Federal Reserve, Standard & Poor’s, Bloomberg, Moody’s Analytics, 31 December 2022; See appendix for definitions. Indices are unmanaged and do not take into account fees, expenses, and transaction costs and it is not possible to invest in an index.

While some of U.S. commercial real estate’s income yield can be attributed to an illiquidity premium, a large portion can be explained by increasing rent growth, occupancy levels, and long-term leasing agreements that help lock in more stable income returns—even through periods of negative economic growth.

Is real estate still an inflation hedge?

Inflation has been an overriding economic theme and risk to both the economic and commercial real estate outlook over the past two years. In 2022, consumer price inflation averaged 8%, its highest rate in a calendar year dating back to 1981 when consumer prices increased by 10.4%. As was the case more than 40 years ago, aggressive action by the Federal Reserve Bank sent interest rates higher, putting pressure on the economy and risk assets. Similarly, the rapid shift from accommodative to restrictive monetary policy has hurt property returns. In fact, since Q4 2022 the NPI has underperformed inflation for the first time since the GFC. Over the history of the NPI dating back to 1978, however, this has been a rare occurrence. Commercial real estate returns have historically outpaced inflation offering an excess return 87.3% of the time based on quarterly returns since 1978 across all property types. Periods where private real estate has underperformed inflation have generally corresponded to capital market dislocations or economic recessions such as the Savings & Loan crisis in the 1980s/90s and the GFC.

In the current environment, property returns have been compromised by historically low cap rates and tight spreads in a rising interest rate environment, which has resulted in lack of sales activity due to widening bid-ask spreads. Stress in the office market, due to the structural impact of the COVID-19 pandemic resulting in low levels of office utilization, has also pushed property returns lower.

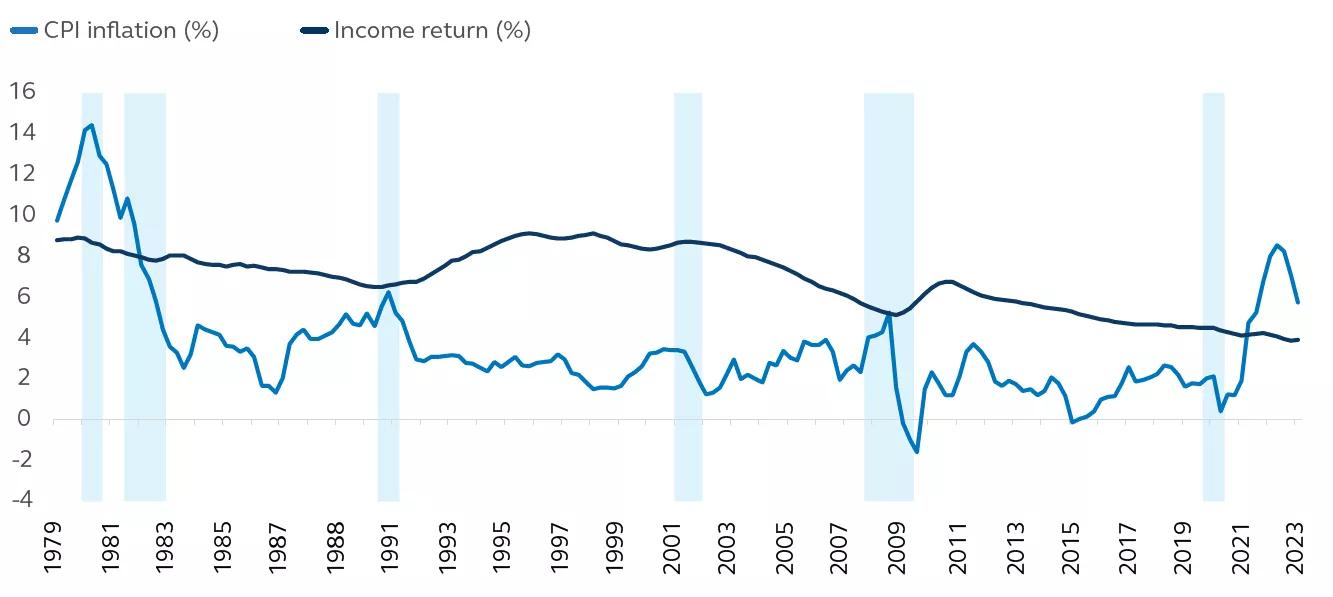
That said, we still feel that there is a case for private commercial real estate as an inflation hedge. The overriding reason is the ability of commercial real estate to provide more stable income returns for long-term investors. Income has accounted for a large majority (roughly 77%) of the NPI index total returns since inception, averaging 6.9% since 1978. Over that same timeframe, inflation measured by the consumer price index averaged 3.5% (see exhibit 9).

EXHIBIT 9: Income returns provide a hedge against inflation
NPI annual income return and inflation

Line graph

Source: NCREIF, Bureau of Labor Statistics, Principal Real Estate, Q1 2023.

Commercial real estate performance can also be shown to have a positive correlation with inflation. This is partially due to asset inflation or increases in capital values that occur during periods where price increases are high, as well as the ability to increase income based on leasing structure. But not all property types are created equal, as office and multifamily have the strongest positive historical correlation inflation, while retail and hotel have the weakest.

We acknowledge that unanticipated inflation creates problems for real estate investors, such as cost overruns on new development; overages on operating expenses; and more costly tenant improvement packages. Real estate, however, is unique among most other asset classes in that much of its return is derived from income that is generated from longer-term leases (with the notable exception of hotels). Income is often indexed to inflation with escalator clauses built into leases that are tied to CPI inflation, which helps preserve income over time. This is particularly true for office and industrial leases where leases run between five to 10 years, while shorter leases in retail and multifamily may also offer benefits through the pooling effect from multiple tenants within a single asset.

Lower volatility, better risk adjusted returns

When compared with other risk assets, such as stocks and even REITs, private commercial real estate is a comparatively lower risk and higher return option. When assessing the risk of an asset, the degree to which the return varies period-to-period, also known as its standard deviation or volatility, is commonly used. When calculating private commercial real estate’s volatility against other asset classes, it is less risky on a relative basis. For example, since 1977 private U.S. CRE has a standard deviation of 7.4% compared with public CRE of 19.2% and U.S. equities of 17.1%. While this lower reward-to-risk tradeoff is convincing in and of itself, one of its more persuasive arguments comes with its addition to a well-diversified investment portfolio.

EXHIBIT 10: U.S. CRE returns are attractive on an absolute and risk-adjusted basis
Returns and volatility across asset classes (Q4 1977 - Q4 2022)

bar chart

Source: NCREIF, NAREIT, Barclays Live, Bloomberg, ANREV, INREV, 31 December 2022; See appendix for definitions.
(*) Indices full history only dating back to Q4 2004, Q1 2000, and Q4 1987 for APAC and European Private CRE, and Global Equities (ex. U.S.), respectively. Indices are unmanaged and do not take into account fees, expenses, and transaction costs and it is not possible to invest in an index.

Commercial real estate continues to improve portfolio outcomes

A well-held belief in finance is that a properly diversified portfolio of multiple assets may allow investors to gain a greater return for each unit of risk taken. In deciding this optimal allocation of investment funds, an asset’s risk-return profile as well as its correlation with other assets plays an important role in this decision.

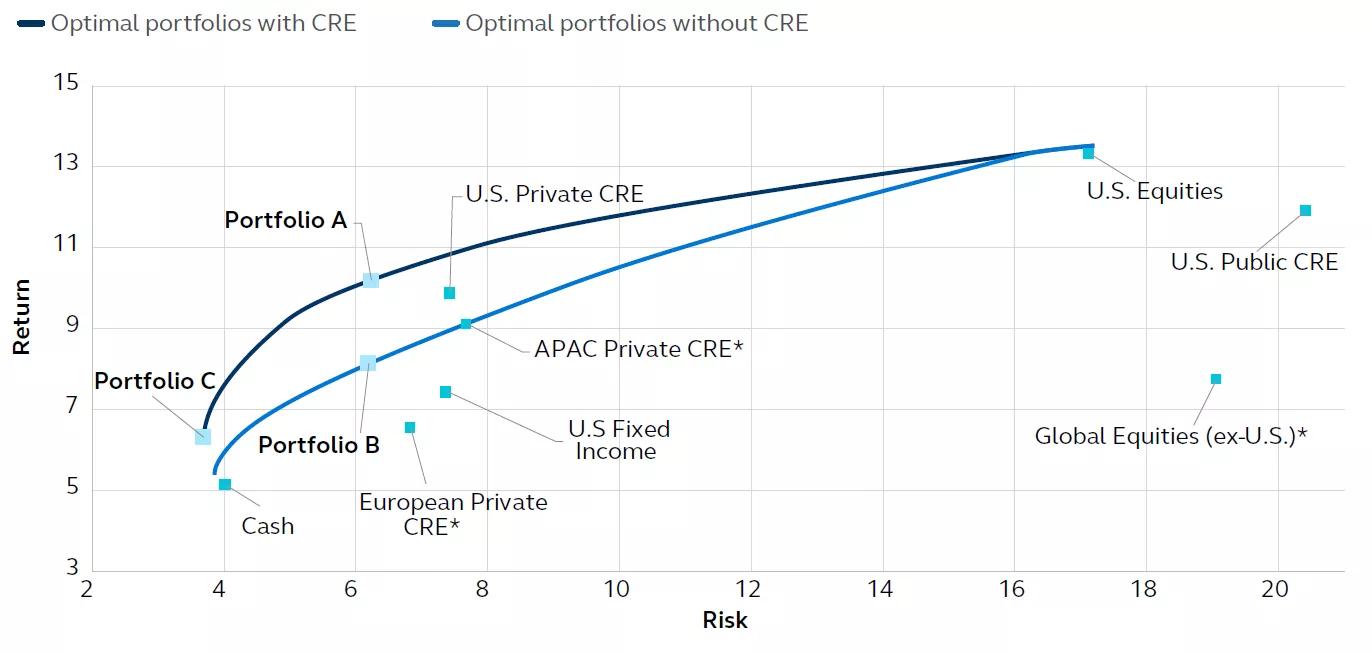
Using the quarterly annual total returns of seven asset classes (Cash, U.S. Bonds, U.S. Stocks, Global Stocks ex. U.S., APAC CRE, EU CRE, U.S. CRE) from Q4 1978 to Q4 2022, Exhibit 11 displays the optimal investment portfolios constructed on a risk-return basis. The upper line (dark blue) outlines the highest return for each level of risk taken in a portfolio that includes all asset class options mentioned above while the lower line (light blue) displays the same frontier of assets but with U.S. commercial real estate removed as an investment choice. What this illustrates is that adding any allocation of U.S. commercial real estate to a portfolio already invested in some combination of global stocks, bonds, cash, and non-U.S. CRE has historically increased the portfolio’s overall return while also reducing its risk. For example, looking at portfolios A and B outlined below, if an investor wanted to construct the highest historical returned portfolio by choosing a level of risk at 6.2%, a portfolio comprised of bonds, cash, U.S. stocks, and REITs would yield an expected return of 7.6%. At that same level of risk, however, if the investor added U.S. commercial real estate in the portfolio construction, they would have been able to achieve roughly a 210 basis point increase in the portfolio’s return (9.7%). Moreover, this example also reveals that an investor wanting to take the least amount of risk possible would be better served not investing entirely in short-term cash (traditionally considered risk- free). The bottom line for investors is that adding U.S. private equity commercial real estate may allow them to achieve higher returns at the same risk profile than portfolios that omit the asset class altogether.

EXHIBIT 11: Optimal portfolio asset frontiers with and without U.S. CRE
Portfolio risk/return allocations (%), Q4 1978 to Q4 2022

Scatter plot

Source: NCREIF, INREV, ANREV, Bloomberg, Barclays Live, Principal Asset Management, 31 December 2022.
(*) Indices full history only dating back to Q4 2004, Q1 2000, and Q4 1987 for APAC and European Private CRE, and Global Equities (ex. U.S.), respectively. Indices are unmanaged and do not take into account fees, expenses, and transaction costs and it is not possible to invest in an index.

Table

Conclusion

While the global investment landscape may call for a more cautious risk-off approach over the next year, given higher than average inflation, elevated policy and borrowing rates, and increased risk of recession, asset classes that dampen volatility, reduce correlation to global markets, and generate income, remain at the forefront for prudent investors.

At its core, U.S. commercial real estate remains an asset class that benefits from positive economic and demographic fundamentals. Although the near-term macroeconomic outlook remains uncertain, regional diversity within the U.S. economy—across metro areas offers investors a diversification hedge to investors not available in most asset classes. Additionally, with the increased stability of its income return, U.S. commercial real estate provides risk-adjusted returns allowing investors to take advantage of potentially increased returns and the reduced risk of a well-diversified portfolio.

U.S. Private CRE

NCREIF Property Index (NPI) - provides returns for institutional grade real estate held in a fiduciary environment in the U.S.


Cash

ICE BofA US 3-Month Treasury Bill Index - measures the performance of a single issue of outstanding treasury bill which matures closest to, but not beyond, three months from the rebalancing date.


APAC Private CRE

ANREV Quarterly Fund Index (Local Currency Denominated) - measures the net asset value performance of Asia Pacific non-listed real estate funds.


U.S. Fixed Income

Bloomberg US Agg Total Return Value Unhedged USD - is a broad-based flagship benchmark that measures the investment grade, US dollar-denominated, fixed-rate taxable bond market.


European Private CRE

INREV Quarterly Fund Index (Local Currency Denominated) - measures the net asset value performance of European non-listed real estate funds.


U.S. Equities

S&P 500 Total Return Index - is a market-capitalization-weighted index of 500 widelyheld stocks often used as a proxy for the stock market.


U.S. Public CRE

FTSE NAREIT All REITs Total Return Index - market capitalization-weighted index thatand includes all tax-qualified real estate investment trusts (REITs) that are listed on the New York Stock Exchange, the American Stock Exchange or the NASDAQ National Market List.


Global Equities (ex-U.S.)

MSCI ACWI ex USA Gross Total Return USD Index - captures large and mid-cap representation across 22 of 23 Developed Markets (DM) countries. (excluding the US) and 27 Emerging Markets (EM) countries


Private CRE Cap Rates

NCREIF NPI Trends Report; Current Value Cap Rates


REIT CRE Cap Rates

REIT.com: Monthly Historical Index Data: 1972-2023


Bloomberg US Aggregate YTM

Barclay's Live; Yield-To-Maturity, Bloomberg US Agg. Total Return Value Unhedged USD Index


Moody's Aaa Corporate Yield

Moody's Investors Service (MIS); Moody's Analytics


U.S. 10-Year Treasury

Bloomberg; USGG10YR Index; US Generic Govt 10 Yr. Yield


S&P 500 Dividend Yield

Moody's Analytics; Standard & Poor's (S&P), closing value

Index performance information reflects no deduction for fees, expenses, or taxes. Indices are unmanaged and individuals cannot invest directly in an index.

1 Seven-year annualized return represents the go-forward return from an investment in the designated time. For example, an investment made in Q1 2008
2 Principal Real Estate, CoStar Portfolio Strategy, CBRE-EA , 2022
3 Market Value Capitalization of the Wilshire 5000 (US Stocks) and the Barclays/Bloomberg US Aggregate, 31 December 2022
4 MSCI Real Capital Analytics, Cross Border Compendium, May 2023
5 Federal Reserve, NAREIT, Preqin, CoStar Portfolio Strategy, J.P. Morgan , 31 December, 2022
6 Based on data from NCREIF Query Tool, NCREIF Research Database, Q1 2023 for all properties in NPI or ODCE.

Real estate
Disclosure

For Public Distribution in the United States. For Institutional, Professional, Qualified, and/or Wholesale Investor Use Only in other Permitted Jurisdictions as defined by local laws and regulations.

Risk Considerations
Investing involves risk, including possible loss of principal. Past performance does not guarantee future results. Potential investors should be aware of the risks inherent to owning and investing in real estate, including: value fluctuations, capital market pricing volatility, liquidity risks, leverage, credit risk, occupancy risk and legal risk. All these risks can lead to a decline in the value of the real estate, a decline in the income produced by the real estate and declines in the value or total loss in value of securities derived from investments in real estate. Asset allocation and diversification do not ensure a profit or protection against loss.

Important information
This material covers general information only and does not take account of any investor’s investment objectives or financial situation and should not be construed as specific investment advice, a recommendation, or be relied on in any way as a guarantee, promise, forecast or prediction of future events regarding an investment or the markets in general. The opinions and predictions expressed are subject to change without prior notice. The information presented has been derived from sources believed to be accurate; however, we do not independently verify or guarantee its accuracy or validity. Any reference to a specific investment or security does not constitute a recommendation to buy, sell, or hold such investment or security, nor an indication that the investment manager or its affiliates has recommended a specific security for any client account. Subject to any contrary provisions of applicable law, the investment manager and its affiliates, and their officers, directors, employees, agents, disclaim any express or implied warranty of reliability or accuracy and any responsibility arising in any way (including by reason of negligence) for errors or omissions in the information or data provided.

This material may contain ‘forward-looking’ information that is not purely historical in nature and may include, among other things, projections and forecasts. There is no guarantee that any forecasts made will come to pass. Reliance upon information in this material is at the sole discretion of the reader.

All figures shown in this document are in U.S. dollars unless otherwise noted.

This material is not intended for distribution to or use by any person or entity in any jurisdiction or country where such distribution or use would be contrary to local law or regulation.

Principal Global Investors, LLC (PGI) is registered with the U.S. Commodity Futures Trading Commission (CFTC) as a commodity trading advisor (CTA), a commodity pool operator (CPO) and is a member of the National Futures Association (NFA). PGI advises qualified eligible persons (QEPs) under CFTC Regulation 4.7.

This document is issued in:

  • The United States by Principal Global Investors, LLC, which is regulated by the U.S. Securities and Exchange Commission.
  • Europe by Principal Global Investors (Ireland) Limited, 70 Sir John Rogerson’s Quay, Dublin 2, D02 R296, Ireland. Principal Global Investors (Ireland) Limited is regulated by the Central Bank of Ireland. Clients that do not directly contract with Principal Global Investors (Europe) Limited (“PGIE”) or Principal Global Investors (Ireland) Limited (“PGII”) will not benefit from the protections offered by the rules and regulations of the Financial Conduct Authority or the Central Bank of Ireland, including those enacted under MiFID II. Further, where clients do contract with PGIE or PGII, PGIE or PGII may delegate management authority to affiliates that are not authorized and regulated within Europe and in any such case, the client may not benefit from all protections offered by the rules and regulations of the Financial Conduct Authority, or the Central Bank of Ireland. In Europe, this document is directed exclusively at Professional Clients and Eligible Counterparties and should not be relied upon by Retail Clients (all as defined by the MiFID).
  • United Kingdom by Principal Global Investors (Europe) Limited, Level 1, 1 Wood Street, London, EC2V 7 JB, registered in England, No. 03819986, which is authorised and regulated by the Financial Conduct Authority (“FCA”).
  • United Arab Emirates by Principal Global Investors LLC, a branch registered in the Dubai International Financial Centre and authorized by the Dubai Financial Services Authority as a representative office and is delivered on an individual basis to the recipient and should not be passed on or otherwise distributed by the recipient to any other person or organisation.
  • Singapore by Principal Global Investors (Singapore) Limited (ACRA Reg. No. 199603735H), which is regulated by the Monetary Authority of Singapore and is directed exclusively at institutional investors as defined by the Securities and Futures Act 2001. This advertisement or publication has not been reviewed by the Monetary Authority of Singapore.
  • Australia by Principal Global Investors (Australia) Limited (ABN 45 488 068, AFS Licence No. 225385, which is regulated by the Australian Securities and Investments Commission and is only directed at wholesale clients as defined under Corporations Act 2001.
  • This document is marketing material and is issued in Switzerland by Principal Global Investors (Switzerland) GmbH.
  • Hong Kong SAR (China) by Principal Asset Management Company (Asia) Limited, which is regulated by the Securities and Futures Commission. This document has not been reviewed by the Securities and Futures Commission.
  • Other APAC Countries/Jurisdictions. This material is issued for Institutional Investors only (or professional/sophisticated/qualified investors, as such term may apply in local jurisdictions) and is delivered on an individual basis to the recipient and should not be passed on, used by any person or entity in any jurisdiction or country where such distribution or use would be contrary to local law or regulation.

Principal Funds are distributed by Principal Funds Distributor, Inc.

©2023 Principal Financial Services, Inc. Principal®, Principal Financial Group®, Principal Asset Management, and Principal and the logomark design are registered trademarks and service marks of Principal Financial Services, Inc., a Principal Financial Group company, in various countries around the world and may be used only with the permission of Principal Financial Services, Inc. Principal Asset ManagementSM is a trade name of Principal Global Investors, LLC. Principal Real Estate is a trade name of Principal Real Estate Investors, LLC, an affiliate of Principal Global Investors.

3013721
About the author